Chapter 7 Estimation
Plug-in estimators: use the corresponding statistic from the sample to get an estimate of the statistic for the population
The likelihood function \(L(\theta) - L(\theta| x_1, x_2, \ldots, x_n)\) gives the likelihood of \(\theta\), given the data. \(\hat \theta_{MLE}\) is the value of \(\theta\) that maximizes the likelihood, or equivalently that maximizes the log-likelihood
7.1 Estimator
The term Estimator is used for a function of random variables. The result from a set of observations is called Estimate
7.2 Fitting Weibull
negloglik <- function(theta){
    -sum(log(dweibull(Turbine$AveSpeed, shape=theta[1], theta[2])))
}
theta <- c(1,1)
result <- nlm(negloglik, theta)
## Warning in dweibull(Turbine$AveSpeed, shape = theta[1], theta[2]): NaNs produced
## Warning in nlm(negloglik, theta): NA/Inf replaced by maximum positive value
## Warning in dweibull(Turbine$AveSpeed, shape = theta[1], theta[2]): NaNs produced
## Warning in nlm(negloglik, theta): NA/Inf replaced by maximum positive value
## Warning in dweibull(Turbine$AveSpeed, shape = theta[1], theta[2]): NaNs produced
## Warning in nlm(negloglik, theta): NA/Inf replaced by maximum positive value
## Warning in dweibull(Turbine$AveSpeed, shape = theta[1], theta[2]): NaNs produced
## Warning in nlm(negloglik, theta): NA/Inf replaced by maximum positive value
## Warning in dweibull(Turbine$AveSpeed, shape = theta[1], theta[2]): NaNs produced
## Warning in nlm(negloglik, theta): NA/Inf replaced by maximum positive value
test <- rweibull(dim(Turbine)[1],result$estimate[1], result$estimate[2])
data <- data.frame(val = c(Turbine$AveSpeed, test), class_type= factor(rep(c("Actual","Estimated"), each =length(test))))
ggplot(data,aes(x=val, colour = class_type))+ stat_ecdf()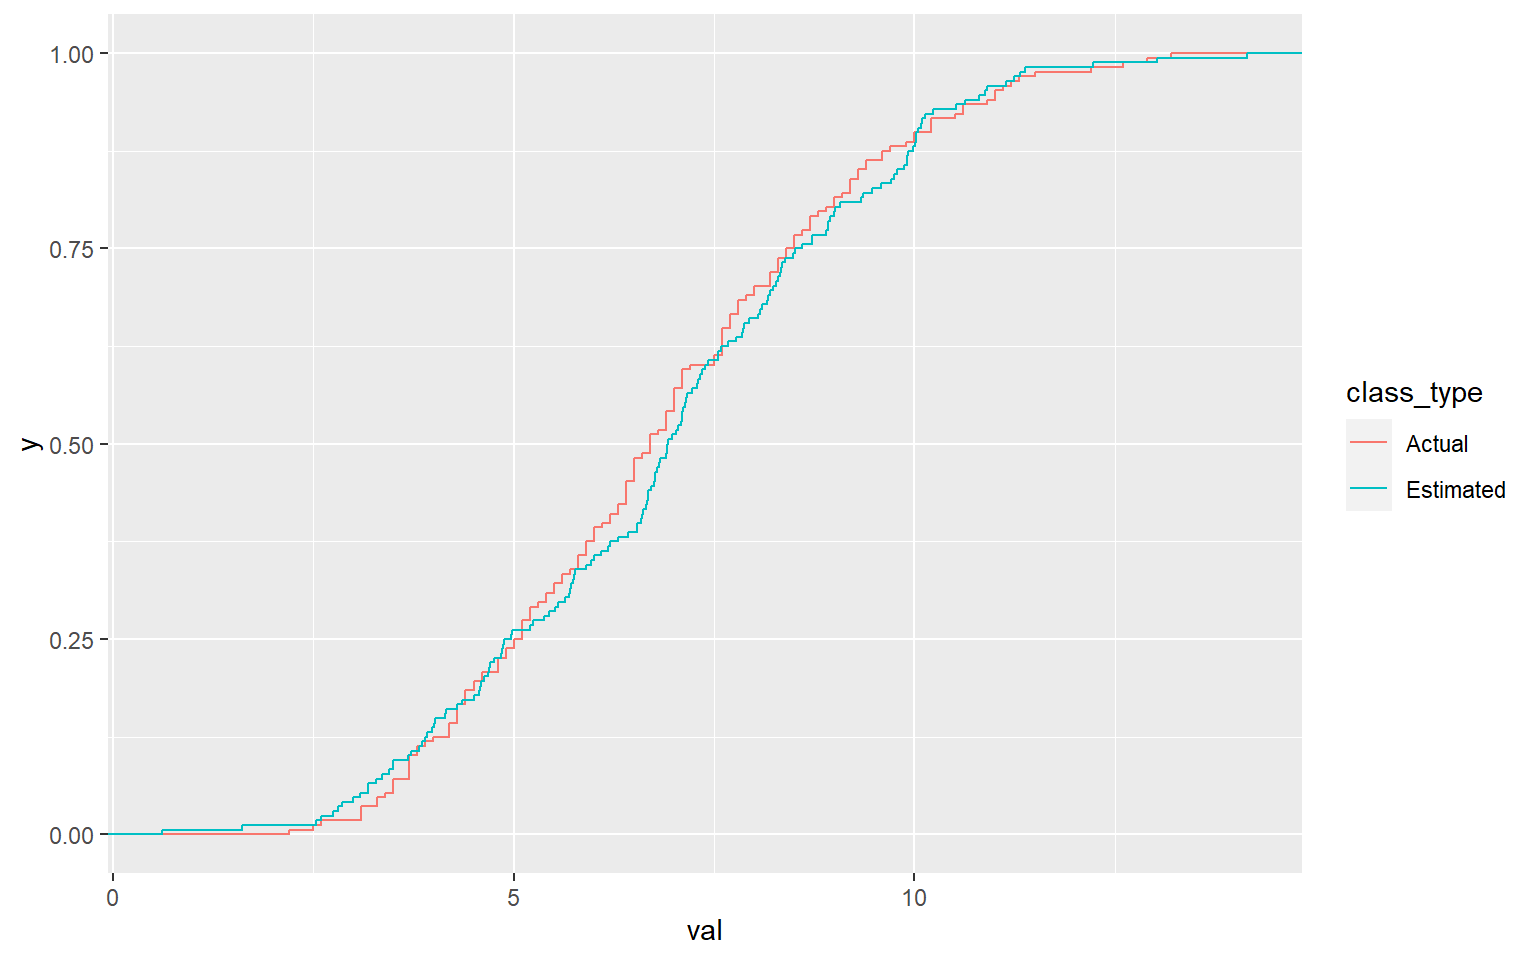
7.3 Estimator Properties
There could be many methods for estimating parameters. How should be decide which one is the best ? There could be three criteria for deciding the best methods 1. Unbiasedness 2. Efficiency : One can compare the variance of the estimator and then say something about the relative efficiency of the estimators 3. Consistency : Consistency means that the estimator gives the right answer in the long run
7.3.1 Cramer-Rao Inequality
If \(X_1, X_2, \ldots X_n\) are a random sample from a distribution with continuous pdf \(f(x;\theta)\) and \(f\) satisfies smootheness criteria, then any unbiased estimator \(\hat \theta\) of \(\theta\) satisfies
\[ Var[\hat \theta] \geq {1 \over n E[\partial/\partial \theta (\ln f(X;\theta)^2)]} \]
7.4 Takeaways
- In the computation of likelihood function, one uses the density function because for small \(h >0\), \(P(a-h < X > a+h)\) is approximately proportional to \(f(a)\)
- Weibull distribution can be used to model the time to failure of an equipment. It is also used to model distributions of wind speed
- Method of moments is another way to estimate the parameters of the distribution
- Given many estimators, one can use several criteria for choosing one:
- Bias of the estimator
- Variance of the estimator
- MSE that combines bias and variance of the estimator
- Efficiency of the estimator
- Translation invariance of the estimator
- Consistency of the estimator
- Cramer-Rao bound gives the lowest bound possible for any estimator. This means that if an estimator achieves this lower bound, there is no need to search for a better estimator